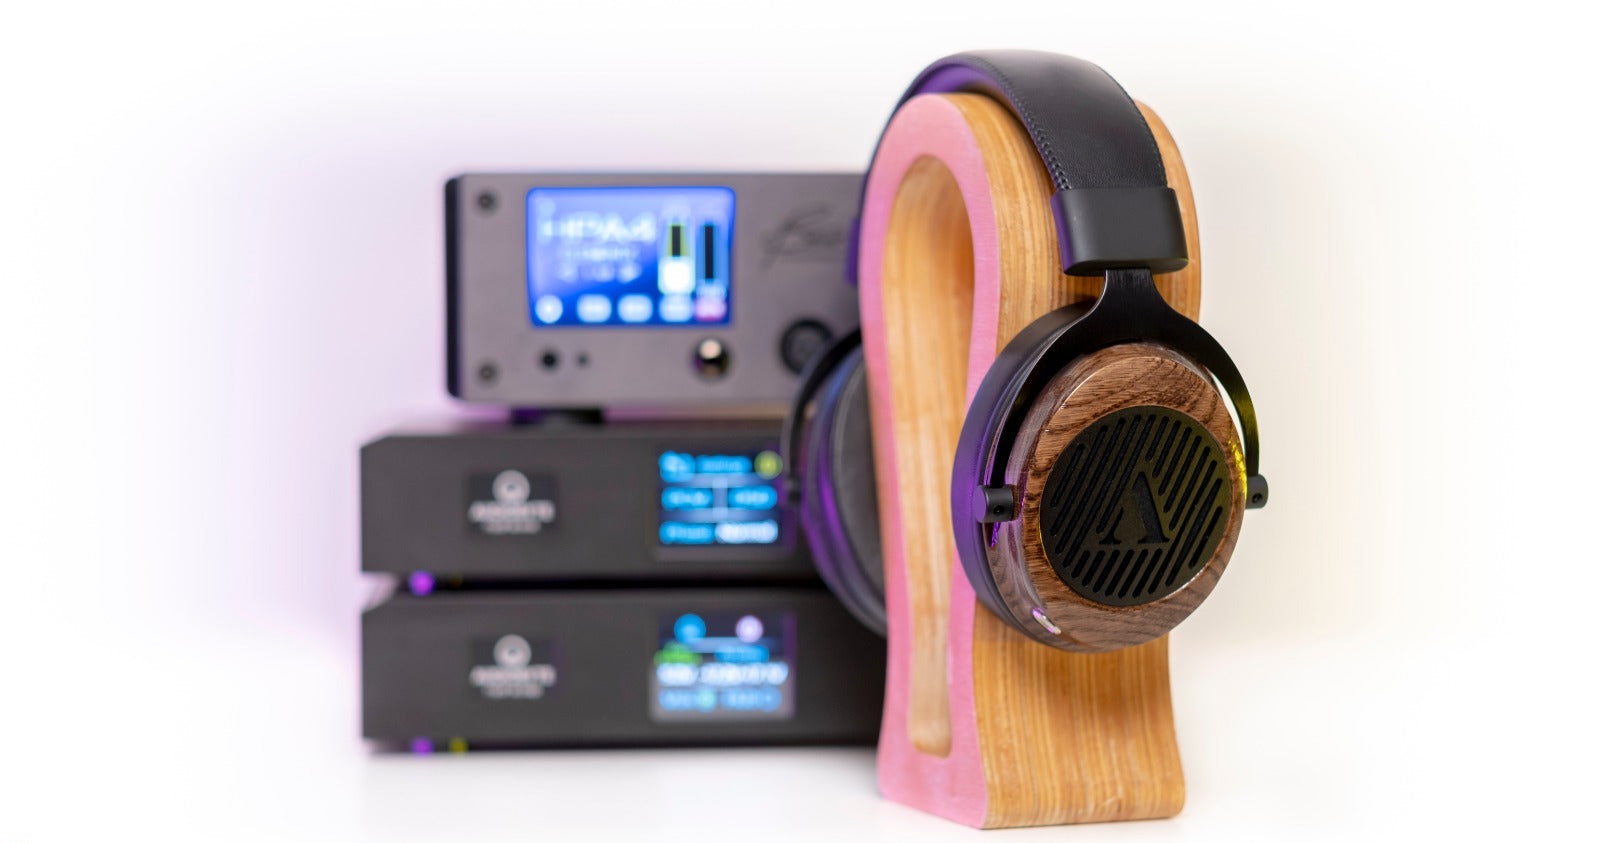
Apos Caspian Measurements: Testing Our First Headphone
Let’s talk about the Apos Caspian in the international language of audiophilia: charts. These measurements come courtesy of Sandu Vitalie of SoundNews. He used a Benchmark HPA4 amplifier due to its renowned linearity and the Matrix Audio Element X DAC. He did the measurements using MiniDSP EARS calibrated with HPN (Original Headphone Compensation) files. Please note that MiniDSP Ears do not follow IEC standards, meaning that these readings aren’t to be taken as reference measurements but as a general idea of sound signature. No pressure was applied to the ear cups. They stood still in their natural position.
Frequency Response and Driver Matching

The first chart is a frequency response chart. It lets you see the relative differences in decibel levels across the sound frequency spectrum. Those differences make up the Caspian’s sound signature. The red line represents the left headphone driver, the blue represents the right.
The first thing that you’ll notice is that the blue and red lines are almost perfectly in sync. This means that both drivers are matched, which is important for realistic imaging and accurate sound staging.
Let’s take the sound frequency region by region, starting with bass. There’s a 5dB rise between 20Hz and 200Hz that peaks at 48Hz. This spells punchy, energetic low-end.
In the midrange, you’ll notice a smooth valley of -5dB from 200Hz to 2.5kHz. Nevertheless, the midrange is anything but recessed. Vocals are forward and lively. Guitars and violins are enveloping.
Finally, you’ll notice a series of 7dB to 15dB dips between 2K and 7kHz. These gentle dips protect the sensitive parts of your hearing from listening fatigue. The upper treble is active and nuanced, providing airiness and sparkle.
Total Harmonic Distortion

The second chart is a total harmonic distortion chart. This measures the total level of distortion that the Apos Caspian will add to the output signal. The THD of the Caspian is 0.3%, with the peak being 2% in the sub-bass and the lowest point being nearly 0.1% at 7.5kHz. Another way of looking at this is that the output signal is 99.7% pure.
Spectral Decay

The next chart is a spectral decay chart. It shows how quickly a headphone driver stops resonating after a signal has been played. This can tell us how “fast”, or resolving, a headphone is. A fast headphone quickly stops resonating once the signal stops being played, while a slow headphone keeps resonating, almost like a bell. For maximum realism, a faster headphone is better.
We played a 300 Hz sweep at 84dB. 160ms after the sweep, the Caspian driver was resonating at 28.8dB--a 66% reduction in volume. This makes it a rather fast headphone, especially for a dynamic driver.
Waterfall

The waterfall graph combines the frequency response plot and the spectral decay graph into a single graph. The key difference is that it’s much prettier. The x-axis describes frequency. The y-axis describes magnitude of dB, and the z-axis describes time.
What you’ll notice is that the mid-range and high frequencies decay by half of their volume in under 120ms, which means that they resolve very quickly. This spells super realistic reproduction in the mid to high frequency ranges. The bass and sub-bass decay a bit slower, which accounts for some of the visceral rumble of the low end.
Spectrogram

The final chart is a spectrogram. A spectrogram visualizes the frequency response of a headphone over time and can assist in finding unwanted resonances. The x-axis describes the frequency range. The y-axis describes time. The colors describe the magnitude of decibels.
You’ll notice that the Caspian’s drivers are perfectly controlled throughout nearly the entire frequency range. There is a very minor resonance present at 30Hz--see that wisp of blue lingering up to a second--which is a notoriously hard-to-tame region in open back headphones. All things considered, this amount of resonance is too minor to add any % to the overall THD of the headphone and shouldn’t be of concern.


